dashboarding

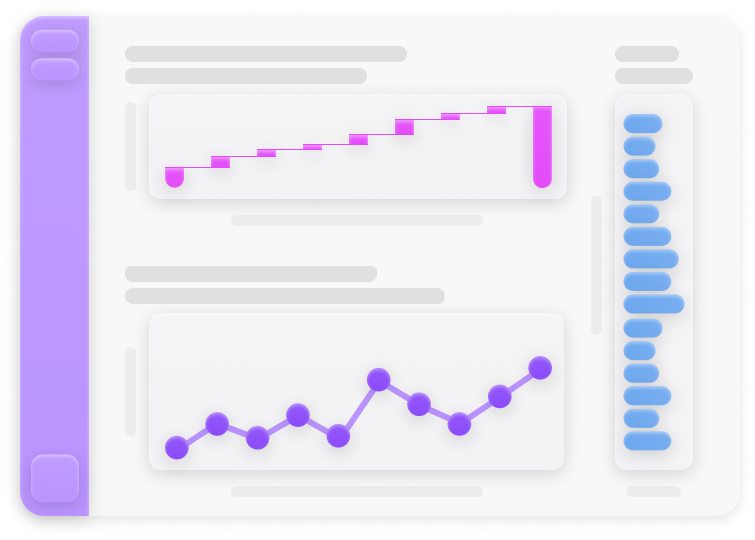
With the right data and complete business context, we create dashboards that are easy to understand but truly actionable. This is the stage where the data is reorganized into insights, trackers, and KPIs that you care about.

We have expert knowledge in Microsoft Power BI, but can also work with tools you're used to - Tableau, Qlik, or others.

planning the layout

A dashboard can be pretty complex, with many pages, visuals, and filters. To make sure we're on the same page, we may start with a wireframe. This is a good moment to discuss whether the dashboard responds to your business needs. We typically do this in Figma, but if you are already using a tool for this, we can adapt.

calculating the measures

While the data fed into the dashboard is already prepared, the dashboard itself requires additional calculations. This is because some values will change depending on the context within the interactive dashboard. These values are called measures, and they often reflect the KPIs that are important to your business.

creating the visuals

Depending on your expectations, we can create a wide range of visuals, including custom visuals otherwise not available in the dashboarding tool. If you have a specific design in mind, we can implement it at this stage. For the dashboard to be truly interactive, it's important to set up filters, slicers, and relationships between the visuals. If you need assistance deciding which visuals best respond to your needs, we can help with that, too.

publishing the report

Depending on how you're planning to use the dashboard, there are various ways to publish it. For example, it can be published directly to the web, embedded in a website, or shared only with specific team members. This also impacts how the data is updated.

ready?

reach out and schedule a free 30-minute consultation

nordic_data

j.hansen@nordic-data.com

+45 42 95 08 64


...or book a free 30-minute consultation

quick links

home

services

pricing

about us

contact

languages

english

dansk